General Science - Online Test
Q1. The _______________ is the easiest measure of dispersion to calculate.
Answer : Option A
Explaination / Solution:
It is easy to calculate because of a simple formula R= L-S where L is largest observation and S is smallest observation.
Q2. Which of the following statements is false?
Answer : Option B
Explaination / Solution:
The elements of Group 1 (alkali metals) have ns1 as outermost electronic configuration. They are all reactive metals with low ionization enthalpies. They lose the outermost electron readily to form 1+ ion. The compounds of the alkali, with the exception of those of lithium are predominantly ionic.
Q3. When coal is used for electricity generation and electricity is consumed by industries than coal becomes the
Answer : Option B
Explaination / Solution:
Electricity, which is transformed from primary sources such as coal and consumed by industries than coal becomes the Primary source.
Q4. Figure shows plot of PV/T versus P for 1.00 kg of oxygen gas at two different temperatures. Comparing and
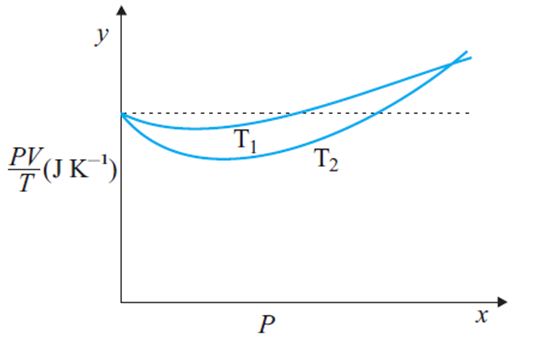
Answer : Option C
Explaination / Solution:
for 1 mole of ideal gas, according to ideal gas equation
hence graph must be with zero slope. So that dotted line show ‘ideal’ gas behavior and curved line shows deviation from ‘ideal’ gas behavior
A real gas behave as ideal gas at high temperature. Temperature T1 is close to dotted line.
so that >
Q5. The cleavage of the zygote or earlier stage of its development into two or more units to form many embryo is called as
Answer : Option B
Explaination / Solution:
Zygote may divides into two or more parts to develop multiple embryos. The formation of more than one embryo inside the same ovule by cleavage is called cleavage polyembryony.
Q6. Diapause is shown by
Answer : Option C
Explaination / Solution:
Dispause is a period during which growth and development is suspended and physiological activity is diminished to adverse environmental condition. Diapause occurs in monarch butterfly and silk worm.
Q7. Which one is prerequisite for nitrogen fixation?
Answer : Option B
Explaination / Solution:
During nitrogen fixation atmospheric nitrogen is converted into nitrates and nitrites. When deficiency of nitrate occurs in soil, nitrogen fixation occurs. So, nitrate deficiency is prerequisite for nitrogen fixation.
Q8.
Answer : Option B
Explaination / Solution:
An amylase is an enzyme that catalyses the hydrolysis of starch into sugars. Amylase is present in the saliva of humans and some other mammals, where it begins the chemical process of digestion. it is a major digestive enzyme, and its optimum pH is 6.8
Q9. Price determination of a commodity is a subject matter of microeconomics.
Answer : Option A
Explaination / Solution:
Micro economics deals with the behaviour of individual economic units such as consumers and business firm and is concerned with the determination of relative prices of commodities and factors of production.
Q10. A plano-convex lens is made of glass of refractive index 1.5. The focal length f of the lens & the radius of curvature R of its curved surface, are related by
Answer : Option A
Explaination / Solution:
No Explaination.
