Electrical Engineering - Online Test
Q1. There are four chips each of 1024 bytes connected to a 16 bit address bus as
shown in the figure below, RAMs 1, 2, 3 and 4 respectively are mappped to
addresses
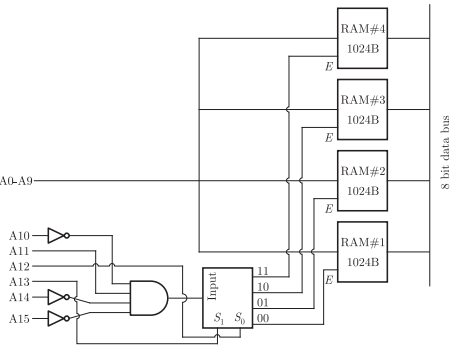
Answer : Option D
Explaination / Solution:
No Explaination.
Q2. For the transfer function G(j𝜔) = 5 + j𝜔, the corresponding Nyquist plot for positive frequency has the form
Answer : Option A
Explaination / Solution:
G(j𝜔) = 5 + j𝜔
Here σ = 5. Thus G(j𝜔) is a straight line parallel to j𝜔 axis
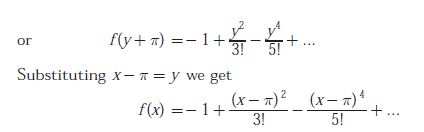
Q3. The Taylor series expansion of 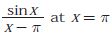 is given by
is given by
Answer : Option D
Explaination / Solution:
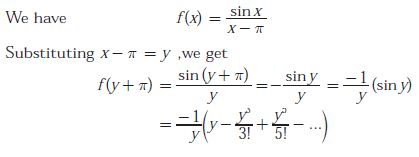
Q4. The block diagram of a system with one input it and two outputs y1 and y2 is
given below
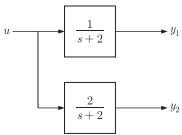
A state space model of the above system in terms of the state vector  and the
output vector
and the
output vector  is.
is.
is.
Answer : Option B
Explaination / Solution:
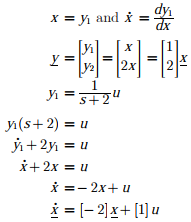
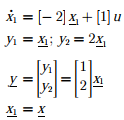
Drawing SFG as shown below
Q5. Given that F(s) is the one-side Laplace transform of f (t), the Laplace transform 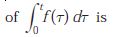
Answer : Option B
Explaination / Solution:
By property of unilateral laplace transform
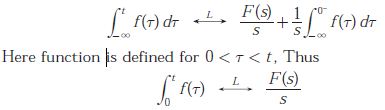
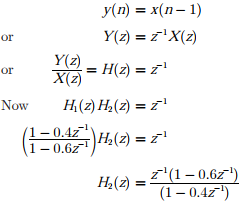
Q6. Two systems H1(Z) and H2(Z) are connected in cascade as shown below. The
overall output y(n) is the same as the input x(n) with a one unit delay. The
transfer function of the second system H2(Z)is
Answer : Option B
Explaination / Solution:
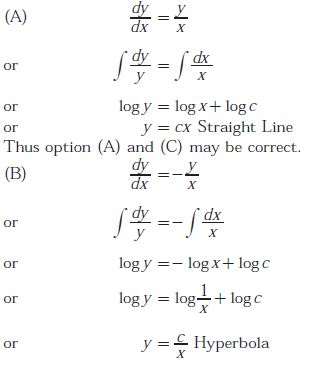
Q7. Match each differential equation in Group I to its family of solution curves from Group II
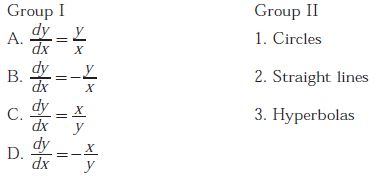
Answer : Option B
Explaination / Solution:
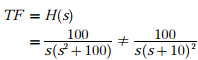
Q8. The input-output transfer function of a plant 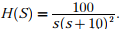 The plant is
placed in a unity negative feedback configuration as shown in the figure below.
The plant is
placed in a unity negative feedback configuration as shown in the figure below. 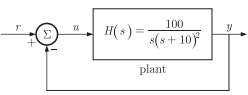
The plant is
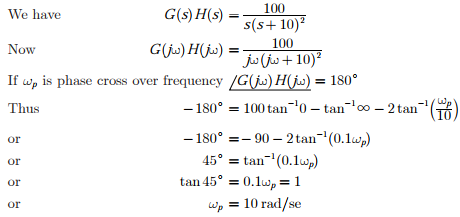
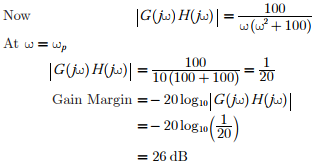
placed in a unity negative feedback configuration as shown in the figure below. The gain margin of the system under closed loop unity negative feedback is
Answer : Option C
Explaination / Solution:
Q9. The Eigen values of following matrix are

Answer : Option D
Explaination / Solution:
Sum of the principal diagonal element of matrix is equal to the sum of Eigen values. Sum of the diagonal element is -1 - 1 + 3 = 1.In only option (D), the sum of Eigen values is 1.
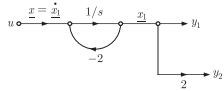
Q10. The input-output transfer function of a plant The plant is placed in a unity negative feedback configuration as shown in the figure below.
The plant is placed in a unity negative feedback configuration as shown in the figure below. The signal flow graph that DOES NOT model the plant transfer function H(S) is
Answer : Option D
Explaination / Solution: