Control Systems - Online Test
Q1.
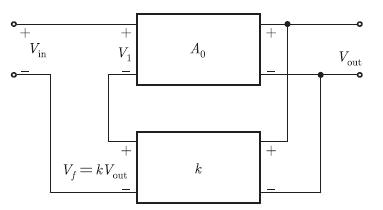
In a voltage-voltage feedback as shown below, which one of the following statements is TRUE if the gain k is increased?
Answer : Option A
Explaination / Solution:
The i/p voltage of the system is given as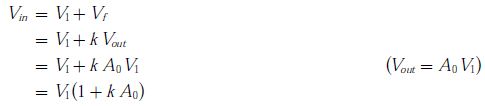
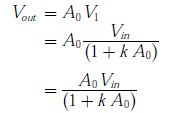
Therefore, if k is increased then input voltage is also increased so, the input impedance increases. Now, we have
Since, Vin is independent of k when seen from output mode, the output voltage decreases with increase in k that leads to the decrease of output impedance. Thus, input impedance increases and output impedance decreases.
Q2.
Which one of the following statements is NOT TRUE for a continuous time causal and stable LTI system?
Answer : Option C
Explaination / Solution:
For a system to be casual, the R.O.C of system transfer function H(s) h which is rational should be in the right half plane and to the right of the right most pole.
For the stability of LTI system. All poles of the system should lie in the left half of S -plane and no repeated pole should be on imaginary axis. Hence,
options (A), (B), (D) satisfies an LTI system stability and causality both.
But, Option (C) is not true for the stable system as, ƖsƖ =1 have one pole in right hand plane also.
Q3. An analog signal is band-limited to 4 kHz, sampled at the Nyquist rate and the samples are quantized into 4 levels. The quantized levels are assumed to be independent and equally probable. If we transmit two quantized samples per second, the information rate is ________ bits / second.
Answer : Option D
Explaination / Solution:
Quantized 4 level require 2 bit representation i.e. for one sample 2 bit are required. Since 2 sample per second are transmitted we require 4 bit to be transmitted per second.
Q4. The root locus plot for a system is given below. The open loop transfer function
corresponding to this plot is given by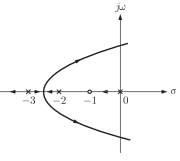
Answer : Option B
Explaination / Solution:
For given plot root locus exists from -3 to ∞, So there must be odd number of
poles and zeros. There is a double pole at s = - 3
Now poles = 0, -2, -3, -3
zeros = - 1
Thus transfer function 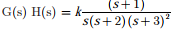
Q5. For the transfer function G(j𝜔) = 5 + j𝜔, the corresponding Nyquist plot for positive frequency has the form
Answer : Option A
Explaination / Solution:
G(j𝜔) = 5 + j𝜔
Here σ = 5. Thus G(j𝜔) is a straight line parallel to j𝜔 axis
Q6. The block diagram of a system with one input it and two outputs y1 and y2 is
given below
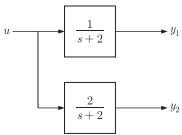
A state space model of the above system in terms of the state vector  and the
output vector
and the
output vector  is.
is.
is.
Answer : Option B
Explaination / Solution:
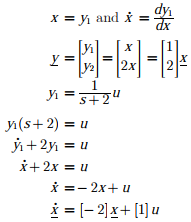
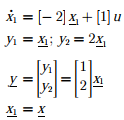
Drawing SFG as shown below
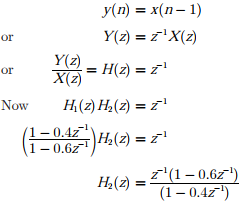
Q7. Two systems H1(Z) and H2(Z) are connected in cascade as shown below. The
overall output y(n) is the same as the input x(n) with a one unit delay. The
transfer function of the second system H2(Z)is
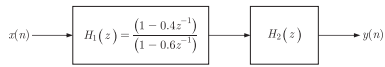
Answer : Option B
Explaination / Solution:
Q8. The input-output transfer function of a plant 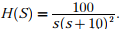 The plant is
placed in a unity negative feedback configuration as shown in the figure below.
The plant is
placed in a unity negative feedback configuration as shown in the figure below. 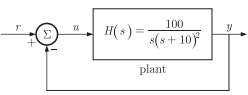
The plant is
placed in a unity negative feedback configuration as shown in the figure below. The gain margin of the system under closed loop unity negative feedback is
Answer : Option C
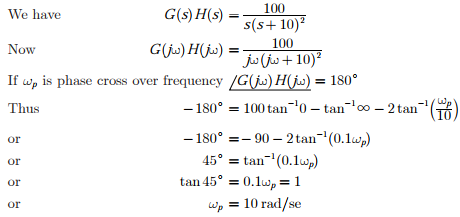
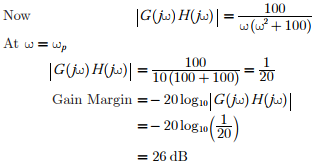
Explaination / Solution:
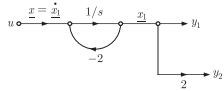
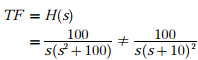
Q9. The input-output transfer function of a plant The plant is placed in a unity negative feedback configuration as shown in the figure below.
The plant is placed in a unity negative feedback configuration as shown in the figure below. The signal flow graph that DOES NOT model the plant transfer function H(S) is
Answer : Option D
Explaination / Solution:
Q10. Consider the sequence x[n] = anu[n] + bnu[n], where u[n] denotes the unit-step sequence and 0 < |a| < |b| < 1. The region of convergence (ROC) of the z-transform of x[n] is
Answer : Option B
Explaination / Solution:
No Explaination.
