Economics - Online Test
Q1. Which of the following is not the function of environment
Answer : Option C
Explaination / Solution:
Functions of the environment
- Environment supplies resources for production.
- Environment assimilates waste,
- Environment sustains life ,
- Environment enhances the quality of life.
Q2. One of the various quantitative instruments used by the central bank in during inflation is
Answer : Option B
Explaination / Solution:
No Explaination.
Q3. A composite price index where the prices of the items in the composite are weighted by their relative importance is known as the
Answer : Option B
Explaination / Solution:
No Explaination.
Q4. Illiteracy is more among
Answer : Option D
Explaination / Solution:
Poverty, ignorance of parents, lack of facilities in rural areas are some of the major causes for rampant illiteracy among girls in India.
Q5. Identify the type of classification from the following diagram
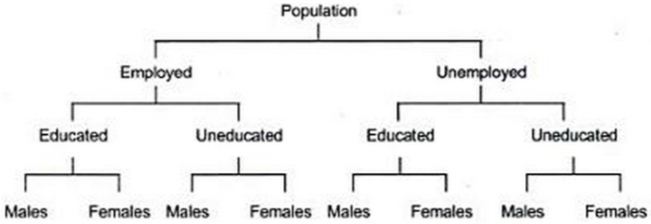
Answer : Option D
Explaination / Solution:
If a population is divided into a number of mutually exclusive classes according to some given characteristic and then each class is divided by reference to some second, third, etc. characteristic, the final grouping is called a manifold classification.
Q6. Wealth is redistributed from creditors to debtors when inflation was
Answer : Option C
Explaination / Solution:
No Explaination.
Q7. Condition for producer equilibrium is:
Answer : Option C
Explaination / Solution:
No Explaination.
Q8. The equation of saving function is
Answer : Option D
Explaination / Solution:
No Explaination.
Q9. During major part of British period
Answer : Option A
Explaination / Solution:
During major part of British period exports was more than imports. The resulted in favourable balance of trade.
Q10. _____ refers to the method or process of presenting data in the form of rows and columns and ____ refers to the actual presentation of data on the form of rows and columns
Answer : Option C
Explaination / Solution:
In a tabular presentation, data are presented in rows (read horizontally) and columns (read vertically). The most simple way of conceptualising a table is to present the data in rows and columns alongwith some explanatory notes. Tabulation can be done using one-way, two-way or three-way classification depending upon the number of characteristics involved
