Logical Reasoning - Online Test

Q1. Find the number of triangles in the given figure.

Answer : Option D
Explaination / Solution:

The figure may be labelled as shown.

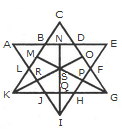
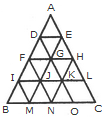
The simplest triangles are ABL, BCD, DEF, FGP, PGH, QHI, JQI, KRJ and LRK i.e. 9 in number.

The triangles composed of two components each are OSG, SGQ, SPI, SRI, KSQ, KMS, FGH, JHI and JKL i.e. 9 in number.

There is only one triangle i.e. KSG which is composed of four components.

The triangles composed of five components each are NEI, ANI, MCG and KCO i.e. 4 in number.

The triangles composed of six components each are GMK and KOG i.e. 2 in number.

There is only one triangle i.e. AEI composed of ten components.

There is only one triangle i.e. KCG composed of eleven components.

Therefore, Total number of triangles in the given figure = 9 + 9+1 + 4 + 2+1 + 1 = 27.


Q2. The cases of food poisoning due to consumption of liquor in rural areas are far greater than such cases in urban areas. Hence it can be concluded that the liquor supplied in rural areas is of low quality than that supplied in urban areas. 

A). The prices of liquor are lower in rural areas than in urban areas. 
B). Percentage of people consuming liquor is more in rural areas than in urban areas. 
C). There are many unauthorized spurious liquor shops in the rural areas. 
D). Number of people suffering from food poisoning due to consumption of liquor as a percentage of people who consume liquor is almost equal for both urban areas and rural areas.

Which of the above statements numbered (A), (B), (C) and (D) if true will most weaken the given argument?
Answer : Option B
Explaination / Solution:

(A) is irrelevant and (C) supports the given argument. (B) weakens the argument by saying that since more people consume liquor in rural areas hence it is normal that the cases of food poisoning are more in rural areas. Similarly (D) also weakens the argument.

Q3. Find the number of triangles in the given figure.

Answer : Option C
Explaination / Solution:

The figure may be labelled as shown.

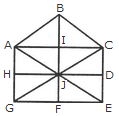
The simplest triangles are ABI, BIC, AIJ, CIJ, AHJ, CDJ, JHG, JDE, GJF and EJF i.e. 10 in number.

The triangles composed of two components each are ABC, BCJ, ACJ, BAJ, AJG, CJE and GJE i.e. 7 in number.

The triangles composed of four components each are ACG, ACE, CGE and AGE i.e. 4 in number.

Total number of triangles in the figure =10+ 7 + 4 = 21.


Q4.
Directions: These questions are based on statement given below and the sentences labeled (A), (B), (C) and (D) as given below. 

The cases of food poisoning due to consumption of liquor in rural areas are far greater than such cases in urban areas. Hence it can be concluded that the liquor supplied in rural areas is of low quality than that supplied in urban areas. 

A). The prices of liquor are lower in rural areas than in urban areas. 
B). Percentage of people consuming liquor is more in rural areas than in urban areas. 
C). There are many unauthorized spurious liquor shops in the rural areas. 
D). Number of people suffering from food poisoning due to consumption of liquor as a percentage of people who consume liquor is almost equal for both urban areas and rural areas.
Which of the above statements numbered (A), (B), C. and (D) if true will strengthen the given argument?
Answer : Option C
Explaination / Solution:

Only (C) supports the argument saying that there are many unauthorized spurious liquor shops in the rural areas due to which the low-quality liquor is supplied in rural areas.

Q5. Find the number of triangles in the given figure.

Answer : Option D
Explaination / Solution:

The figure may be labelled as shown.

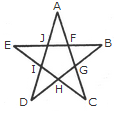
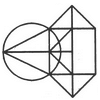
The simplest triangles are AJF, FBG, GCH, HDI and IEJ i.e. 5 in number.

The triangles composed of three components each EBH, AIC, EFC, ADG and BJD i.e. 5 in number.

Thus, there are 5 + 5 = 10 triangles in the figure.


Q6.
Directions: Study the following information carefully and answer the questions given below: 

Poverty measurement is an unsettled issue, both conceptually and methodologically. Since poverty is a process as well as outcome; many come out of it while others may be falling into it. The net effect 
of these two parallel processes is a proportion commonly identified as the ‘head count ratio’, but these ratios hide the fundamental dynamism that characterizes poverty in practice. The most recent poverty reestimates by an expert group has also missed the crucial dynamism. In a study conducted on 13,000 households which represented the entire country in 1993-94 and again on 2004-05, it was found that in the ten-year period 18.2% rural population moved out of poverty whereas another 22.1% fell into it over this period. This net increase of about four percentage points was seen to have a cons variation across stales and regions.
Which of the following is an assumption which is implicitin the facts stated in the above paragraph?
Answer : Option A
Explaination / Solution:

Accurate poverty measurement is not possible in India

Q7. Find the minimum number of straight lines required to make the given figure.

Answer : Option B
Explaination / Solution:

The figure may be labelled as shown.

The horizontal lines are DE, FH, IL and BC i.e. 4 in number.

The slanting lines are AC, DO, FN, IM, AB, EM and HN i.e. 7 in number.

Thus, there are 4 + 7 = 11 straight lines in the figure.


Q8.
Directions: Study the following information carefully and answer the questions given below: 

Poverty measurement is an unsettled issue, both conceptually and methodologically. Since poverty is a process as well as outcome; many come out of it while others may be falling into it. The net effect 
of these two parallel processes is a proportion commonly identified as the ‘head count ratio’, but these ratios hide the fundamental dynamism that characterizes poverty in practice. The most recent poverty reestimates by an expert group has also missed the crucial dynamism. In a study conducted on 13,000 households which represented the entire country in 1993-94 and again on 2004-05, it was found that in the ten-year period 18.2% rural population moved out of poverty whereas another 22.1% fell into it over this period. This net increase of about four percentage points was seen to have a cons variation across stales and regions.
Which of the following is a conclusion which can be drawn from the facts stated in the above paragraph?
Answer : Option C
Explaination / Solution:

Process of poverty measurement needs to take into account various factors to tackle its dynamic nature

Q9. Find the number of triangles in the given figure.

Answer : Option C
Explaination / Solution:

The figure may be labelled as shown.

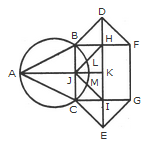
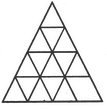
The simplest triangles are ABJ, ACJ, BDH, DHF, CIE and GIE i.e. 6 in number.

The triangles composed of two components each are ABC, BDF, CEG, BHJ, JHK, JKI and CJI i.e. 7 in number.

There is only one triangle JHI which is composed of four components.

Thus, there are 6 + 7 + 1 = 14 triangles in the given figure.


Q10.
Directions: Study the following information carefully and answer the questions given below : 
Poverty measurement is an unsettled issue, both conceptually and methodologically. Since poverty 
is a process as well as outcome; many come out of it while others may be falling into it. The net effect 
of these two parallel processes is a proportion commonly identified as the ‘head count ratio’, 
but these ratios hide the fundamental dynamism that characterizes poverty in practice. The most recent poverty reestimates by an expert group has also missed the crucial dynamism. In a study conducted 
on 13,000 households which represented the entire country in 1993-94 and again on 2004-05, it was found that in the ten-year period 18.2% rural population moved out of poverty whereas another 22.1% fell into it over this period. This net increase of about four percentage points was seen to have a cons variation across stales and regions.
Which of the following is an inference which can be made from the facts stated in the above paragraph?
Answer : Option B
Explaination / Solution:

Increase in number of persons falling into poverty varies considerably across the country over a period of time