Presentation of Data - Online Test
Q1. Identify the bar graph
Answer : Option D
Explaination / Solution:
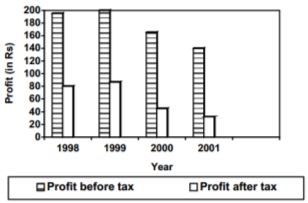
Multiple bar diagrams (m are used for comparing two or more sets of data, in the given bar graph, comparison is shown between profit before tax and profits after tax.
