Measures of Dispersion - Online Test
Q1. Find the range of the group of numbers -10, -8, 1, 11, 19.
Answer : Option A
Explaination / Solution:
R= L-S, Where L is largest item and S is smallest item
R=19-(-10)= 19+10= 29
Q2. If mean and coefficient of variation of a set of data is 10 and 5, then S.D. is
Answer : Option D
Explaination / Solution:
No Explaination.
Q3. Calculate mean deviation from median and its coefficient from the following data : 100, 150, 80, 90, 160, 200, 140
Answer : Option A
Explaination / Solution:
No Explaination.
Q4. Calculate the standard deviation for the following data - 5, 8, 7, 11, 14
Answer : Option B
Explaination / Solution:
No Explaination.
Q5. The symbol σ is used to represent
Answer : Option D
Explaination / Solution:
No Explaination.
Q6. Lorenz Curve was devised by
Answer : Option C
Explaination / Solution:
It was developed by Max O. Lorenz in 1905 for representing inequality of the wealth distribution.
Q7. Lorenz Curve : Used this technique to show
Answer : Option B
Explaination / Solution:
The Lorenz curve is a graphical representation of the distribution of income or of wealth. It was developed by Max O Lorenz in 1905 for representing inequality of the wealth distribution.
Q8. Which of the following is false regarding Dispersion
Answer : Option C
Explaination / Solution:
Dispersion (also called variability, scatter, or spread) is the extent to which a distribution is stretched or squeezed. Common examples of measures of statistical dispersion are the variance, standard deviation, and interquartile range. Dispersion is contrasted with location or central tendancy, and together they are the most used properties of distributions.
Q9. Arrange the following steps to find out standard deviationsa. Find out deviations b. Assume the centre value of the seriesc. Square the deviationsd. Multiply these deviations by frequencies e. Multiply the square deviation by the respective frequencies and obtain the total Options are
Answer : Option B
Explaination / Solution:
No Explaination.
Q10.
Match the following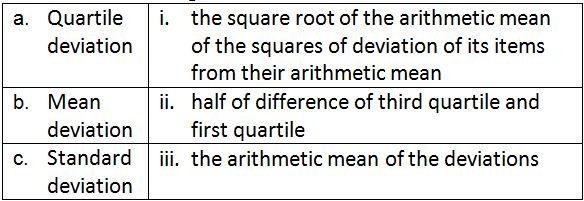
Answer : Option D
Explaination / Solution:
Quartile Deviation (QD) means the semi variation between the upper quartiles (Q3) and lower quartiles (Q1) in a distribution. The mean deviation (also called the mean absolute deviation) is the mean of the absolute deviations of a set of data about the data's mean. Standard deviation is a measure of the dispersion of a set of data from its mean. It is calculated as the square root of variance by determining the variation between each data point relative to the mean. If the data points are further from the mean, there is higher deviation within the data set.
