Introduction to Economics - Online Test
Q1. Identify the data which are not statistics
Answer : Option A
Explaination / Solution:
No Explaination.
Q2. Read the data – It is stated that there are 300 students in art faculty, 400 in commerce faculty and 300 in science faculty .This data represents which characteristics of statistics
Answer : Option B
Explaination / Solution:
No Explaination.
Q3. 30% rises in prices may due to reduction in supply, shortage of power, rise in wages etc. This shows which characteristics of statistics
Answer : Option B
Explaination / Solution:
No Explaination.
Q4. 1 lac people attended the rally addressed by the Prime Minister in Delhi and 2 Lakh in Mumbai. These statistics are based on
Answer : Option C
Explaination / Solution:
No Explaination.
Q5. Which of the following will give quantitative data
Answer : Option B
Explaination / Solution:
No Explaination.
Q6. If it is said that per capita in India is Rs.18000 per annum it does not mean that income of each and every Indian is Rs. 18000 per annum.Which of the drawback of statistics is highlighted in this example
Answer : Option C
Explaination / Solution:
No Explaination.
Q7. Which characteristics of statistics is depends upon purpose of investigation, its nature, size and available resources
Answer : Option A
Explaination / Solution:
No Explaination.
Q8. Economic equilibrium means
Answer : Option D
Explaination / Solution:
No Explaination.
Q9.
Match the following. Options are
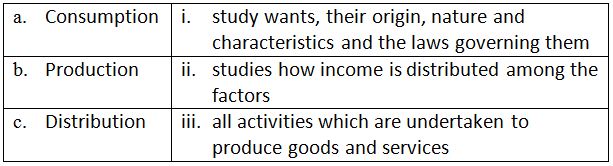
Answer : Option C
Explaination / Solution:
No Explaination.
Q10. Which of the following is false regarding Importance of Statistics in Economics
Answer : Option A
Explaination / Solution:
No Explaination.
